|
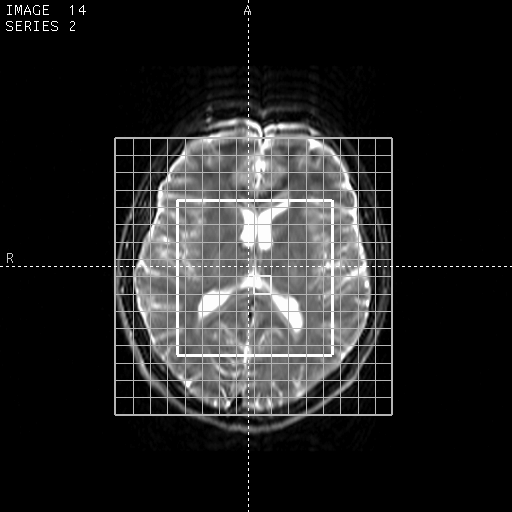
| Figure 1: MR image of the human brain and a grid indicating the positioning of the voxels in the MRSI data set. Only the voxels within the box indicated with the thick white line (8x8) contain useful information. |
(Nuclear) Magnetic Resonance ((N)MR) has become a routinely used method to obtain spatially resolved images in living organisms or to study metabolic changes in a non-invasive way. The most frequently used application of MR on humans or animals is MR imaging (MRI) in which anatomical information is obtained. By using more advanced MR sequences available on modern clinical MR systems, it is also possible to obtain images, which represent for example brain activity (functional MRI or fMRI), blood flow (MR angiography or MRA) or neuronal fibers using diffusion MR imaging.
Another application of clinical MR is MR spectroscopy (MRS) in which chemical information can be obtained from a well-defined region in for example the human brain. MRS signals obtained in animals or human beings are called in-vivo MRS signals and are not represented as images but as spectra. A MRS spectrum can be used to discriminate healthy tissue from for example cancer or to identify metabolic diseases.
Numerous localization techniques have been developed to measure MRS signals in which the single-voxel techniques acquire signals from one spatial location, a voxel. Signals from multiple spatial regions can be acquired simultaneously in one measurement sequence using multi-voxel localization techniques. This application of MRS is often called MRS imaging (MRSI) or chemical shift imaging (CSI) because of the possibility to reconstruct metabolic maps out of the individual MR spectra.
Figure 1 shows a MR image of the human brain and a 16 by 16 grid that indicates the positioning of the voxels in the acquisition of the MRSI data. To reduce artifacts in the data, often single voxel localization techniques are combined with MRSI localization. As a result only the voxels within the inner box indicated in figure 1 show relevant information. The remaining voxels outside that box should contain mainly noise. Some voxels contain mainly water, since they are positioned in the ventricles of the human brain (>99% water). Ventricles can be seen in the middle of the MR image as the areas with the highest intensity.
|
| Figure 1: MR image of the human brain and a grid indicating the positioning of the voxels in the MRSI data set. Only the voxels within the box indicated with the thick white line (8x8) contain useful information. |
Below you can download an in-vivo MRSI data set containing 16 x 16 in-vivo signals measured on a 1.5 Tesla Siemens Vision system. They are characterized by a low signal-to-noise ratio (SNR) due to the inherent low sensitivity of the MRS technique, the limited measurement time and, most of the time, overlapping spectral components. Each of these signals can be modeled by an appropriate model function after removal of the residual water using for example HLSVD techniques. The models most often used are a sum of Lorentzian, Gaussian or Voigt lineshapes.
The data set consist of 16 times 16 matlab files, csi-xx-yy.mat, xx ranging from 0 to 15, yy ranging from 0 to 15. xx denotes the row number, yy the column number, 00 is the signal obtained from the voxel in the upper left corner of the grid. Each matlab file contains a variable called signal, which contains the 1024 complex time-domain data points. The sampling interval is 1 msec.
| Select the signal and then click the "download" button: |
| Download all 256 signals as 1 zip file (3.87 Mbyte). |